Planning Permission
Made Simple with AI
Get instant, accurate planning permission guidance for your UK property project. AI-powered analysis in minutes, not weeks.
E
or search using MapView
Let us show you around our powerful planning tools. This quick tour will help you get the most out of our platform.
Get instant, accurate planning permission guidance for your UK property project. AI-powered analysis in minutes, not weeks.
We use cookies
We use cookies to enhance your experience, analyze traffic, and for personalization. See our Cookie Policy.
Start with your postcode for a location-specific assessment
Our AI reviews local planning rules and recent decisions
Receive detailed guidance and next steps instantly
We integrate directly with regulatory bodies to ensure you get the most accurate, up-to-date planning information. Join thousands of homeowners, architects & developers who trust our platform.
Official Government Data
Flood Zone & Water Data
SSSI & Protected Areas
Listed Buildings & Heritage
National Mapping Data
Applications & Policy Data
All data sourced from official UK government and regulatory bodies. Updated daily for accuracy and reliability. Covering all 385 local planning authorities across England.
Hear from homeowners and professionals who’ve used Planifly to bring their projects to life!
"Architect"
"Saved me weeks of research. The proximity checker alone is worth the subscription."
"Property Developer"
"Incredibly accurate data. This platform has become essential for our feasibility studies."
"Homeowner"
"Made planning permission so much less stressful. Clear guidance every step of the way."
"Planning Consultant"
"Perfect for quick LPA research before submitting applications."
"Architectural Technologist"
"The policy layer feature saves hours of cross-referencing."
Get the key answers to your planning permission queries faster than ever with smart tools powered by AI.
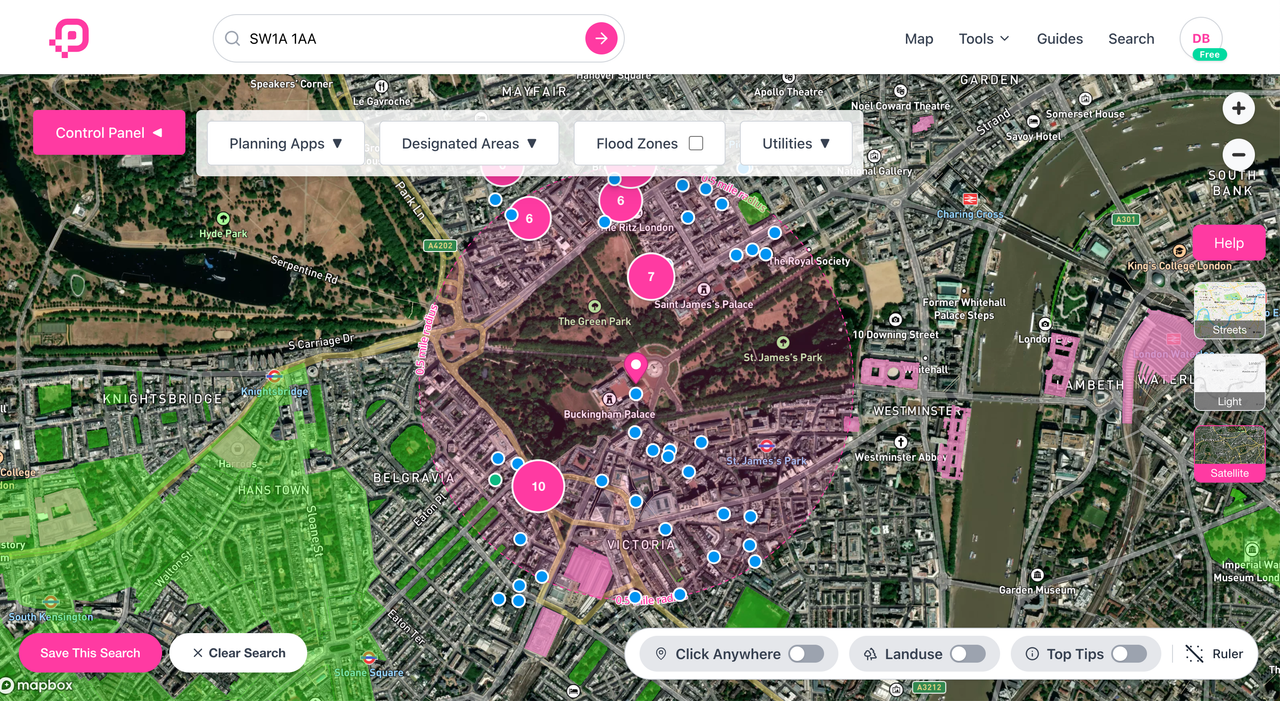
Visualise local planning data, proximities to special designation boundaries including flood zones 2 & 3 plus more. All at the speed of light! Designed for developers, architects, and homeowners.
Visualize planning applications, designations, and flood zones on an interactive map
Calculate Community Infrastructure Levy costs for your development instantly
AI-powered likelihood assessment based on local authority approval patterns
Get personalized planning guidance powered by advanced AI analysis
Track planning decision timelines across all UK local authorities
Check distances to protected areas, conservation zones, and designations
Start with our free plan and explore all features. Upgrade anytime to unlock advanced tools and collaboration features.
Whether you're a homeowner or a planning professional, we have all the tools you need to speed up your planning process.
Planning a home extension, loft conversion, or renovation?
Evaluating sites for residential or commercial development?
Managing multiple client projects simultaneously?
Need to understand planning constraints before quoting?
Click to explore tools for Individuals or Professionals
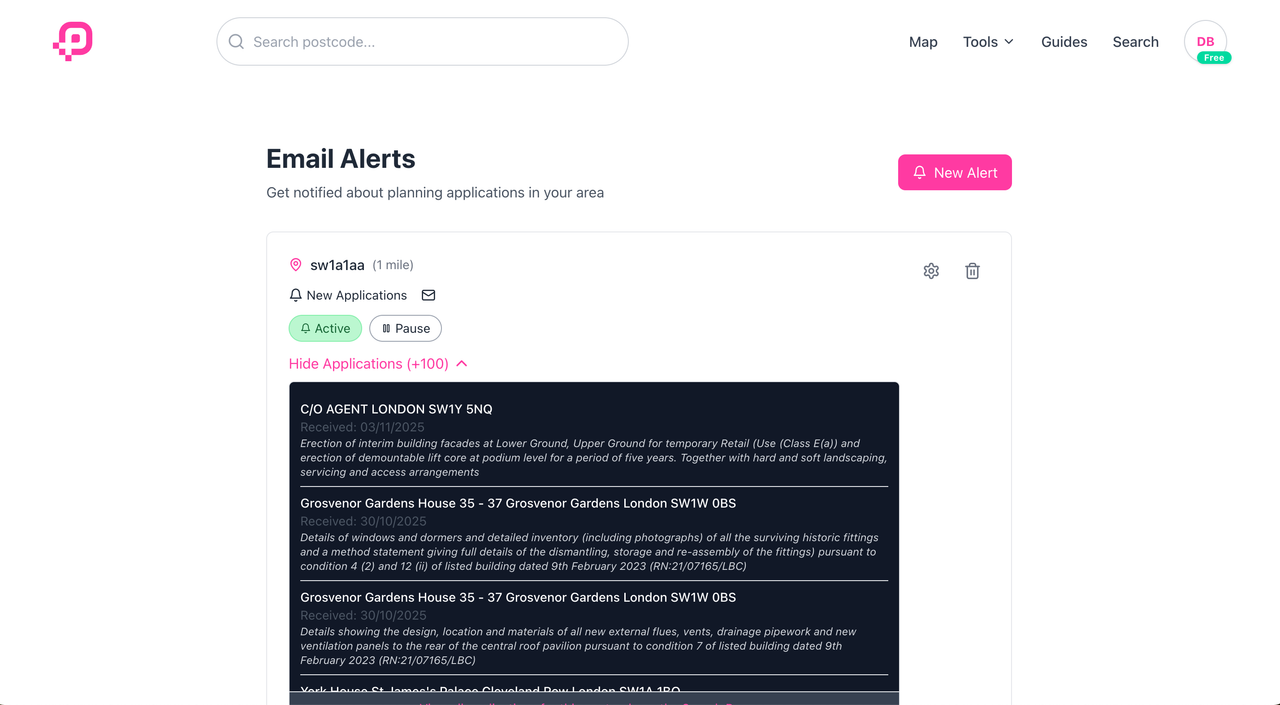
Access your premium planning tools, insights and alerts — all in one place.
Welcome back,
Joe Bloggs
Member since: 15 January 2024
Plan: Pro
BH21 • 1 mile
Radius: 1 • 13 Apr 2026, 11:38
SW11 • 2 miles
Radius: 2 • 12 Apr 2026, 11:38
Make the most of your membership
Create a saved search, follow applications, or set up alerts to start getting personalised updates.
Access your premium planning tools, insights and alerts — all in one place. This preview shows how subscribed members manage searches, alerts, and applications.
We aggregate data from multiple official sources to give you the complete picture
Direct feeds from government and regulatory bodies
All 385 local planning authorities in England
Data refreshed daily for accuracy and reliability
All data is sourced from official government and regulatory bodies including GOV.UK, Environment Agency, Natural England, Historic England, and local planning authorities. We ensure data accuracy through automated validation and daily updates.
See how quickly local planning decisions are being made. Compare authorities and track performance trends over time. Essential insights for developers and homeowners alike.
| # | Authority | Total Decisions▲▼ | % within 8 Weeks▲▼ | |
|---|---|---|---|---|
| 1 | Arun | 1,426 | 90%No change from October to December 2024 | |
| 2 | Sutton | 2,041 | 86%▲(+1%)Up 1% from October to December 2024 | |
| 3 | Castle Point | 863 | 83%▲(+5%)Up 5% from October to December 2024 | |
| 4 | Coventry | 2,328 | 83%▲(+14%)Up 14% from October to December 2024 | |
| 5 | Fareham | 1,149 | 82%No change from October to December 2024 | |
| 6 | Watford | 950 | 82%▼(-3%)Down 3% from October to December 2024 | |
| 7 | Three Rivers | 1,598 | 81%▼(-4%)Down 4% from October to December 2024 | |
| 8 | North Tyneside | 1,224 | 79%▼(-5%)Down 5% from October to December 2024 | |
| 9 | Chelmsford | 2,462 | 79%▲(+7%)Up 7% from October to December 2024 | |
| 10 | Enfield | 3,330 | 79%▼(-1%)Down 1% from October to December 2024 | |
| 11 | Folkestone and Hythe | 1,217 | 77%No change from October to December 2024 | |
| 12 | Medway | 1,764 | 77%▼(-11%)Down 11% from October to December 2024 | |
| 13 | Tunbridge Wells | 2,167 | 77%▼(-2%)Down 2% from October to December 2024 | |
| 14 | Maidstone | 2,094 | 76%▼(-15%)Down 15% from October to December 2024 | |
| 15 | Stevenage | 495 | 75%▲(+11%)Up 11% from October to December 2024 | |
| 16 | Spelthorne | 1,151 | 75%No change from October to December 2024 | |
| 17 | Gravesham | 1,151 | 75%▼(-11%)Down 11% from October to December 2024 | |
| 18 | Shropshire | 4,234 | 74%▼(-8%)Down 8% from October to December 2024 | |
| 19 | Kingston upon Thames | 2,223 | 74%▲(+16%)Up 16% from October to December 2024 | |
| 20 | Wokingham | 2,265 | 72%▼(-2%)Down 2% from October to December 2024 | |
| 21 | Telford and Wrekin | 1,191 | 72%▲(+12%)Up 12% from October to December 2024 | |
| 22 | New Forest | 1,611 | 72%▲(+4%)Up 4% from October to December 2024 | |
| 23 | Redbridge | 3,204 | 72%▼(-3%)Down 3% from October to December 2024 | |
| 24 | Rushmoor | 551 | 72%▲(+13%)Up 13% from October to December 2024 | |
| 25 | Test Valley | 1,714 | 71%▼(-10%)Down 10% from October to December 2024 | |
| 26 | Bexley | 2,520 | 71%▲(+2%)Up 2% from October to December 2024 | |
| 27 | Ebbsfleet Development Corporation4 | 58 | 71%▼(-13%)Down 13% from October to December 2024 | |
| 28 | Isle of Wight | 1,720 | 71%▼(-3%)Down 3% from October to December 2024 | |
| 29 | Manchester | 2,756 | 71%▼(-12%)Down 12% from October to December 2024 | |
| 30 | Sandwell | 1,657 | 71%▼(-1%)Down 1% from October to December 2024 |
Find answers to common questions about Planning Pal, our features, and how to get the most from our platform. View all FAQs